# event-study coefficients from a fitted model
stack_plot(model, combine = c("overlay", "facet"), include_overall = TRUE, ...)

# Q-weighted level outcomes from a stack
stack_plot_levels(stack_data, outcome_var, weight_var = "q_weight",
                  by_group = FALSE, combine = c("facet", "overlay"), ...)

# overlay several models' event studies
stack_plot_compare(models, label_position = c("direct", "legend", "none"), ...)Plots
Event-study, level, and multi-model comparison plots in the package’s figure style (highlight color #E64173, zero/reference lines, direct labels).
R stack_plot(), stack_plot_levels(), stack_plot_compare() ↔︎ Stata stacked plot
Usage
Key arguments
| Argument | Function | Description |
|---|---|---|
model |
stack_plot |
A fit from stackreg(). A stackreg_groups object triggers per-cohort overlay/facet. |
combine |
stack_plot, stack_plot_levels |
"overlay" (marker area = cohort weight) or "facet" (one panel per cohort). |
include_overall |
stack_plot |
Overlay the pooled estimate for grouped objects. |
stack_data, outcome_var |
stack_plot_levels |
Stack and outcome for the levels view. |
weight_var |
stack_plot_levels |
"q_weight" (default) or "q_weight_ps". |
models |
stack_plot_compare |
A named list of models; names label the series. |
label_position |
stack_plot_compare |
"direct" (default), "legend", or "none". |
show_avg_att, title, xlab, ylab, point_color, … |
all | Cosmetic overrides. |
stacked plot [, bygroup combine(str) title(str) noatt twoway_options]

* the level plot is a flag on the levels subcommand:
stacked levels depvar, plot
Options
| Option | Description |
|---|---|
bygroup |
Plot the last stacked reg, bygroup: overlay (marker size = weight) or, with combine(facet), one panel per cohort; after model(att), a cohort coefficient plot. |
combine(str) |
overlay (default) or facet. |
title(str) |
Plot title. |
noatt |
Suppress the average-post-ATT reference line. |
| twoway_options | Passed through to Stata’s twoway. |
stacked plot draws the event study from the most recent stacked reg. The level plot is stacked levels depvar, plot (see levels).
R ↔︎ Stata mapping
| R | Stata |
|---|---|
stack_plot(model) |
stacked plot (uses the last stacked reg) |
stack_plot(groups_obj) / combine |
stacked plot, bygroup combine() |
show_avg_att = FALSE |
noatt |
title |
title() |
stack_plot_levels(stack, y) |
stacked levels y, plot |
stack_plot_compare(models) |
(no single subcommand; overlay twoway manually, or re-plot each stacked reg) |
Value
R functions return a ggplot2 object (or draw a base-R plot and return NULL invisibly if ggplot2 is absent). stack_plot_levels() attaches the underlying means as a "levels_data" attribute.
Stata draws a twoway graph in the current graph window; combine with graph export to save.
Example
library(stacked)
data(medicaid)
stack <- build_stack(medicaid, "year", "state", "adopt_year",
                     kappa_pre = 3, kappa_post = 2)
model <- stackreg(stack, "uninsured", cluster_var = "state")

stack_plot(model, ylab = "Effect on uninsured rate")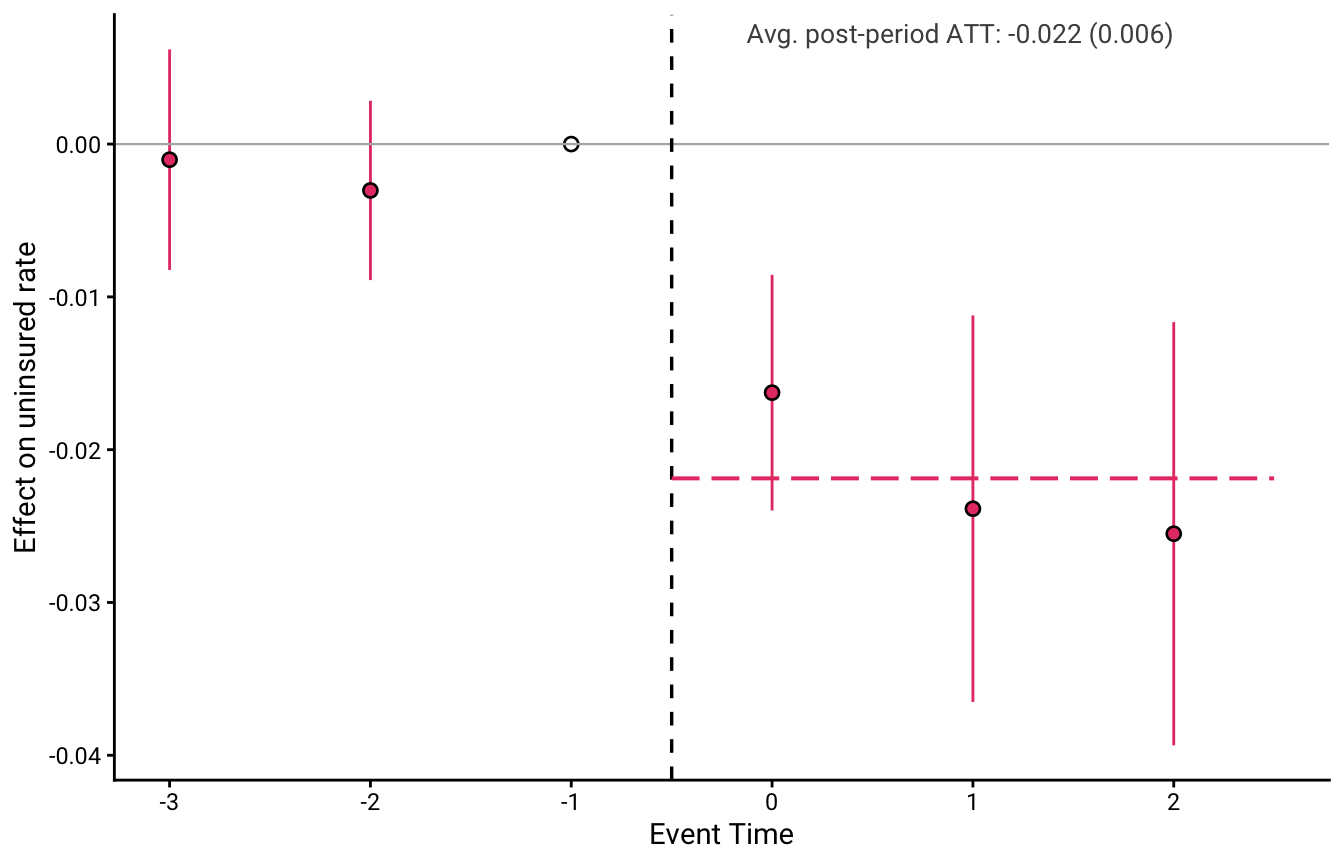
stack_plot_levels(stack, "uninsured", ylab = "Uninsured rate")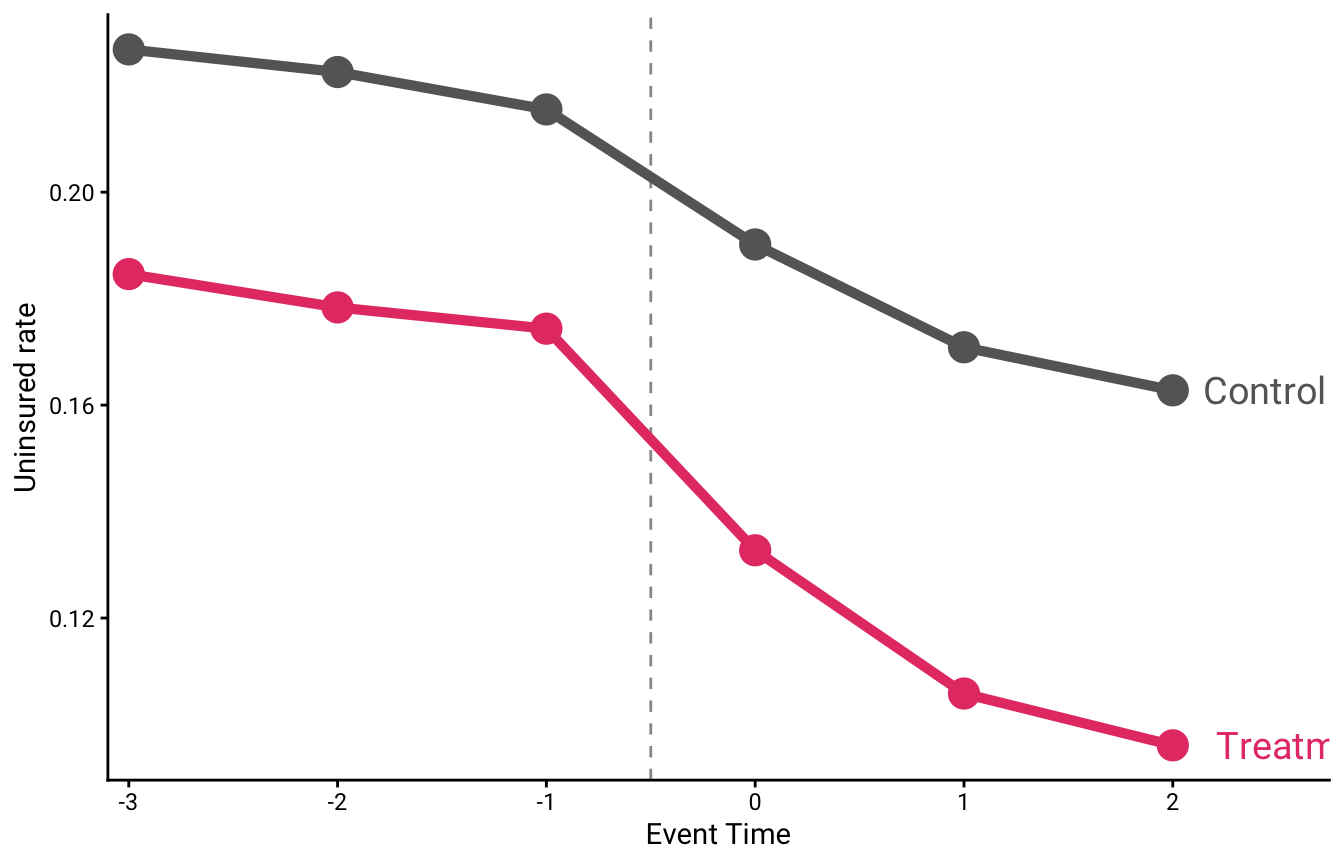
stacked use medicaid, clear
stacked build, time(year) unit(state) adopt(adopt_year) kpre(3) kpost(2)
stacked reg uninsured, cluster(state)

stacked plot, title("Effect of Medicaid expansion on uninsured rate")
stacked levels uninsured, plot

* by-cohort event study, marker size = aggregation weight
stacked reg uninsured, cluster(state) bygroup
stacked plot, bygroup
stacked plot, bygroup combine(facet)
See also
stackreg()/stacked reg— fit the model to plotstack_coefs()— the numbers behindstack_plot()stack_levels()/stacked levels— the numbers behind the level plot