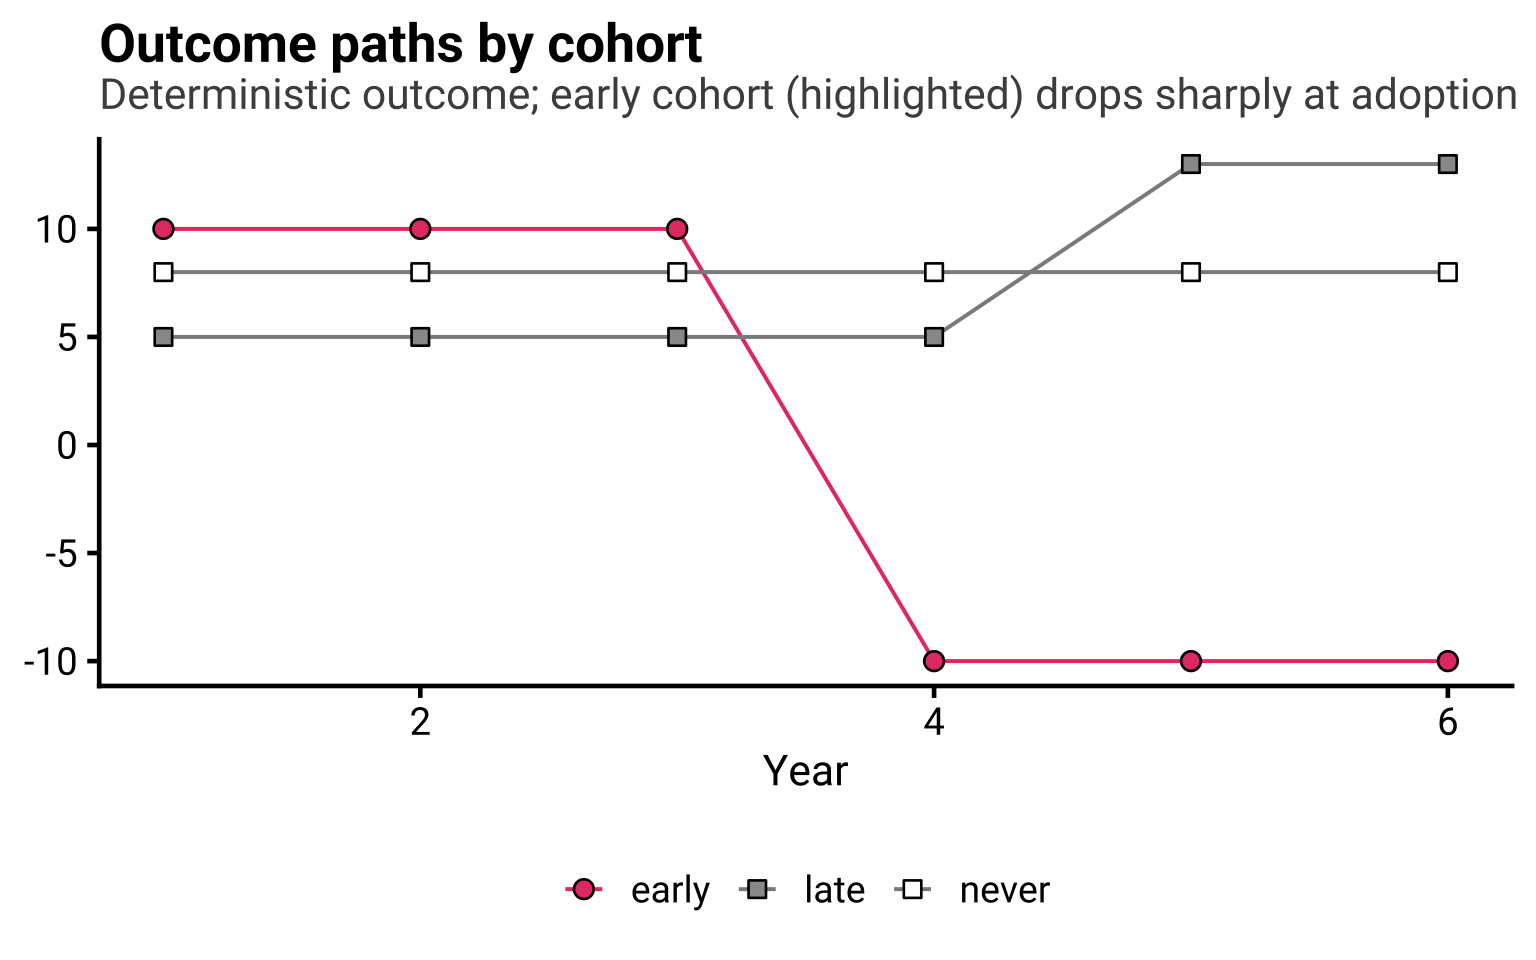
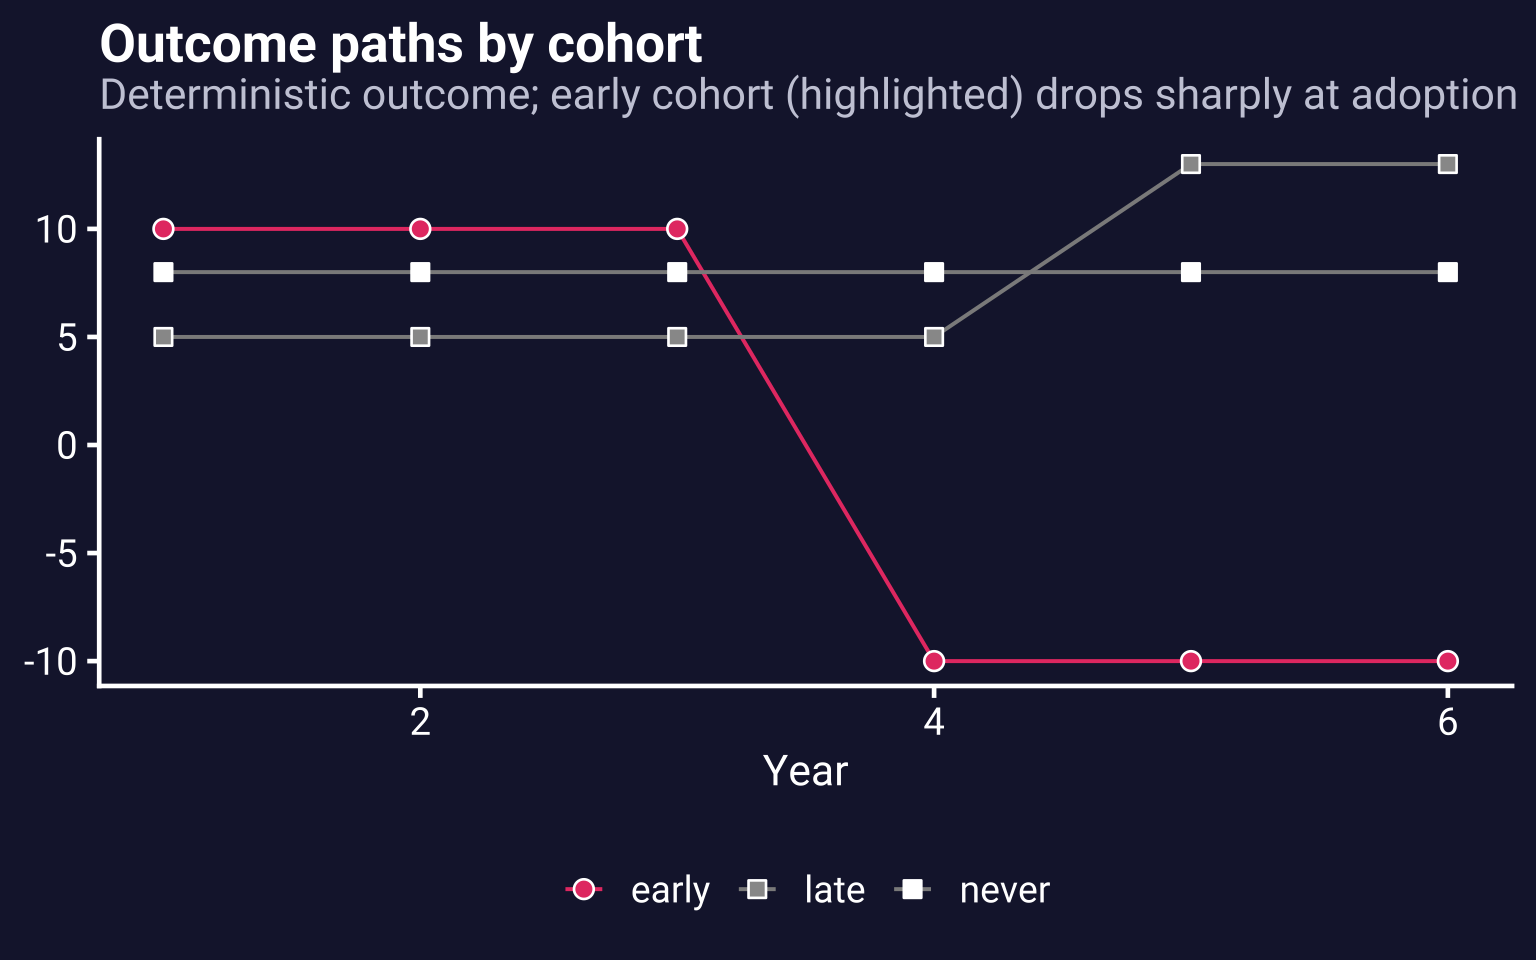
A tiny, deterministic staggered-adoption panel — 12 units over 6 years, no noise — engineered so that naive stacked two-way fixed effects gets the sign of the treatment effect wrong while the corrective Q-weighted estimator recovers it exactly. A small early cohort has a large negative effect and a large late cohort has a positive effect; because unweighted pooling overweights the small early cohort by its greater precision, it lands on the wrong side of zero. It is the scenario the interactive app is built around, in miniature.
Codebook
Variable
Type
Description
id
integer
Unit identifier (1–12)
group
character
"early" (2 units, adopt year 4, effect −20), "late" (8 units, adopt year 5, effect +8), or "never" (2 units)
adopt_year
integer
Treatment adoption year; NA for never-treated
year
integer
Calendar year (1–6)
outcome
numeric
Deterministic outcome (baseline + effect; no noise, so worked numbers are exact)
The treated-unit-weighted target is (2·(−20) + 8·8) / 10 = +2.4. Unweighted pooled OLS on the stack gives −2.769 (wrong sign); the Q-weighted estimate is exactly +2.4.
Source and citation
Generated deterministically by the package (data-raw/signflip.R). No external data. See Wing, C., Freedman, S., & Hollingsworth, A. (2024). Stacked Difference-in-Differences. Working paper.