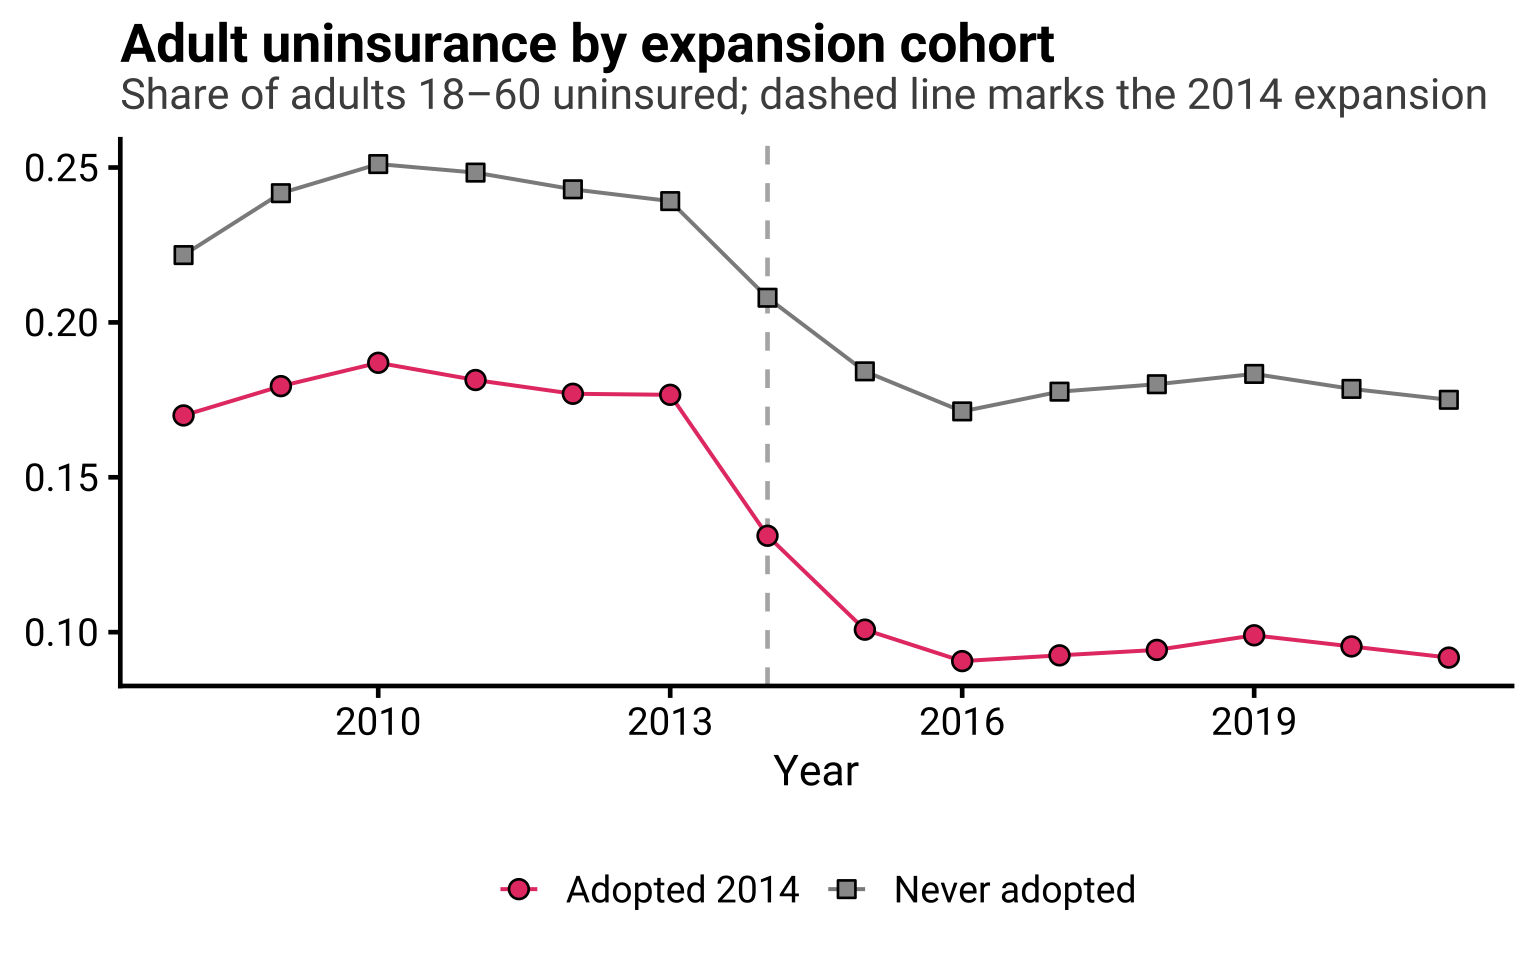
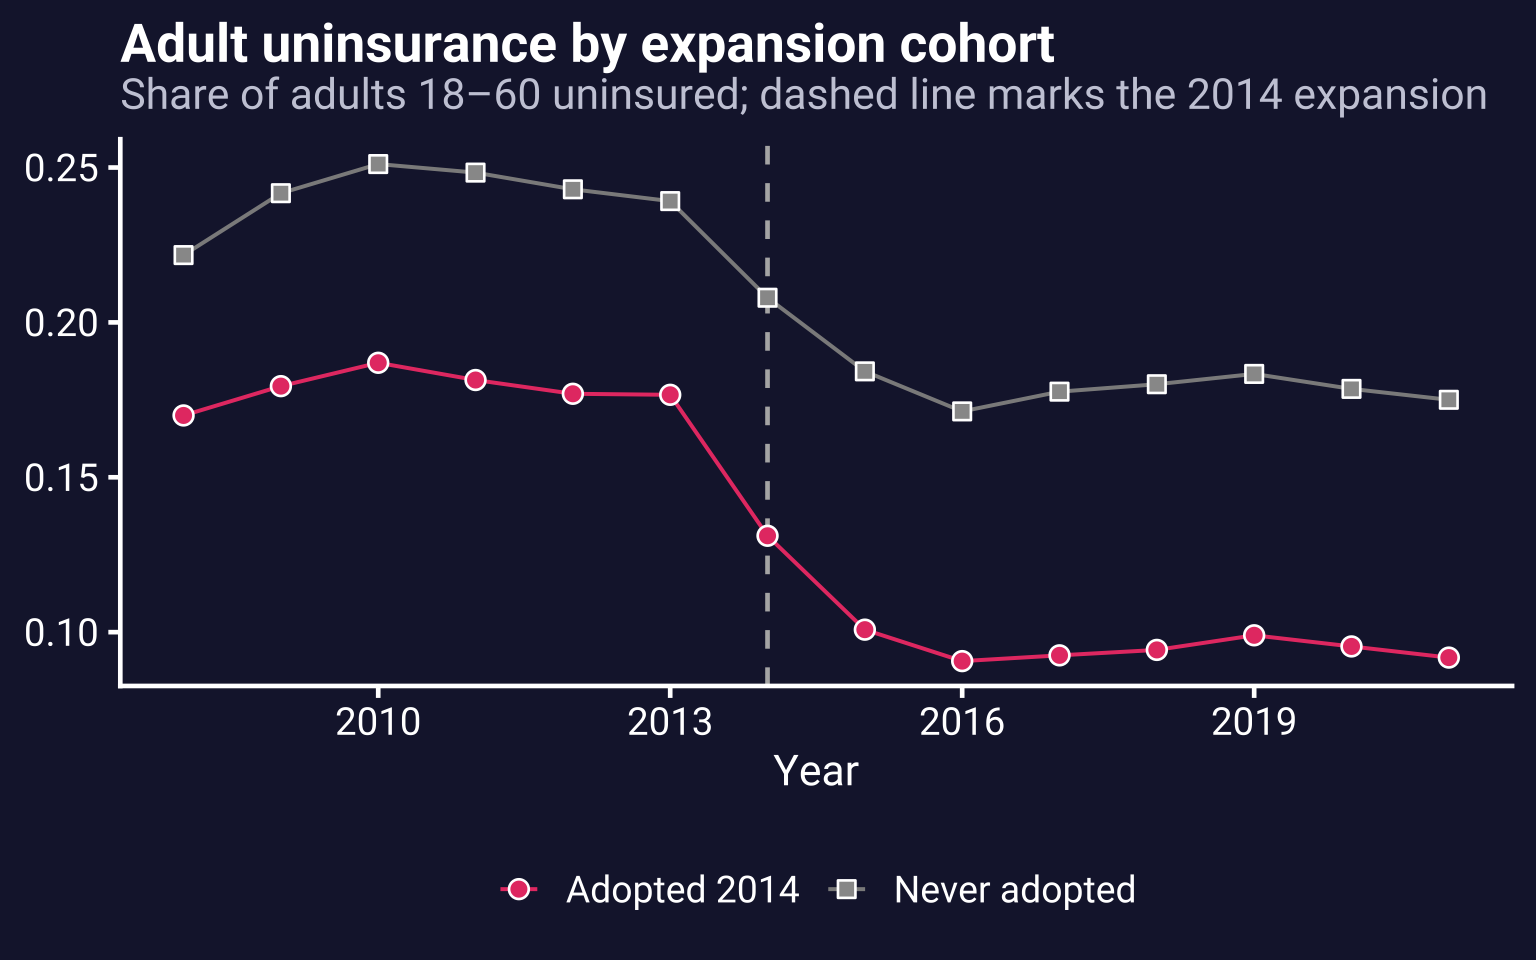
State-level panel of adult uninsurance rates from the American Community Survey, paired with the year each state adopted the ACA Medicaid expansion. It is the headline empirical example in the working paper: 51 states (including DC) observed annually from 2008 to 2021, with adoption staggered across 2014–2020 and twelve states never adopting. Because treatment turns on in different years for different states, it is a canonical staggered-adoption design — the setting the stacked estimator is built for.
Codebook
Variable
Type
Description
state
character
Two-letter state abbreviation
statefip
integer
State FIPS code
year
integer
Calendar year (2008–2021)
adopt_year
integer
Year the state adopted Medicaid expansion (NA if never adopted)
uninsured
numeric
Fraction of adults ages 18–60 without health insurance
Adoption timing: 2014 (25 states), 2015 (AK, IN, PA), 2016 (LA, MT), 2019 (ID, ME, NE, VA), 2020 (MO, OK), and 12 states not adopted by 2021.
Steven Ruggles, Sarah Flood, Matthew Sobek, Daniel Backman, Annie Chen, Grace Cooper, Stephanie Richards, Renae Rodgers, and Megan Schouweiler. IPUMS USA: Version 15.0. Minneapolis, MN: IPUMS, 2024. doi:10.18128/D010.V15.0
Method reference: Wing, C., Freedman, S., & Hollingsworth, A. (2024). Stacked Difference-in-Differences. Working paper.
   state statefip year adopt_year uninsured
1:    AL        1 2008         NA 0.1964095
2:    AL        1 2009         NA 0.2141095
3:    AL        1 2010         NA 0.2300015
4:    AL        1 2011         NA 0.2250678
5:    AL        1 2012         NA 0.2159348
6:    AL        1 2013         NA 0.2218695
dim(medicaid)
[1] 714 5
Preview
source("../assets/style-web.R")d <-copy(medicaid)d[, cohort :=fifelse(is.na(adopt_year), "Never adopted",fifelse(adopt_year == 2014L, "Adopted 2014", "Adopted later"))]agg <- d[cohort !="Adopted later", .(uninsured =mean(uninsured)), by = .(year, cohort)]p_preview <-ggplot(agg, aes(year, uninsured, color = cohort, fill = cohort, shape = cohort)) +geom_vline(xintercept =2014, linetype ="dashed", color ="grey70") +geom_line(linewidth =0.7) +geom_point(size = pt_size, stroke = pt_stroke, color = border_color) +scale_color_manual(values =c("Adopted 2014"= highlight_color,"Never adopted"= grey_line)) +scale_fill_manual(values =c("Adopted 2014"= highlight_color,"Never adopted"= grey_fill)) +scale_shape_manual(values =c("Adopted 2014"= shp_primary,"Never adopted"= shp_grey)) +labs(title ="Adult uninsurance by expansion cohort",subtitle ="Share of adults 18–60 uninsured; dashed line marks the 2014 expansion",x ="Year") + base_theme