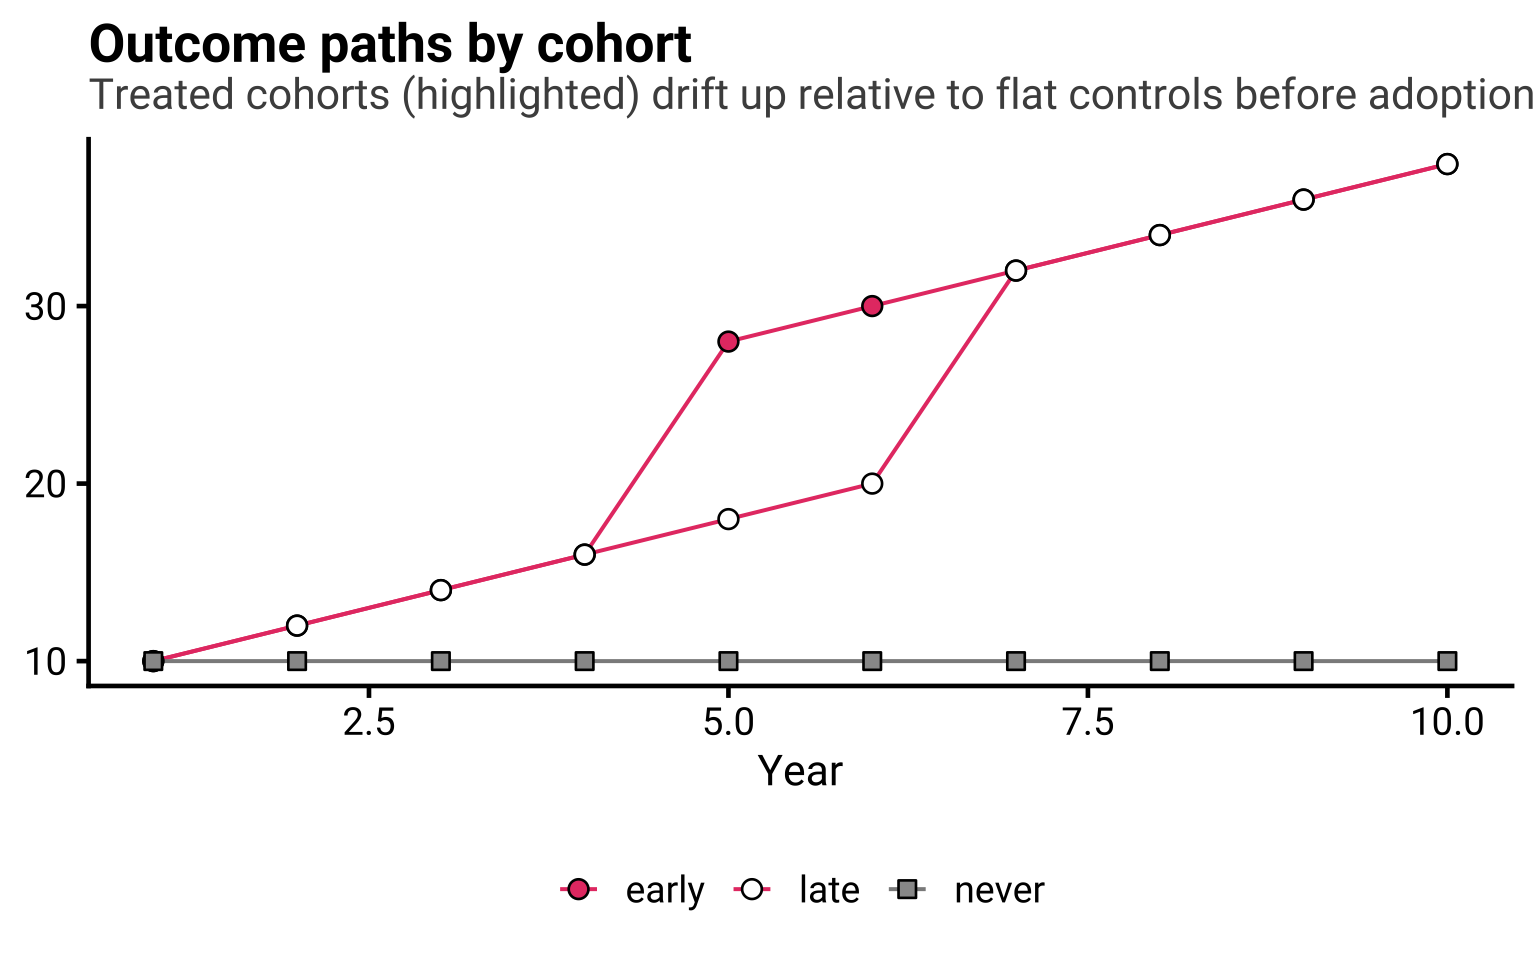
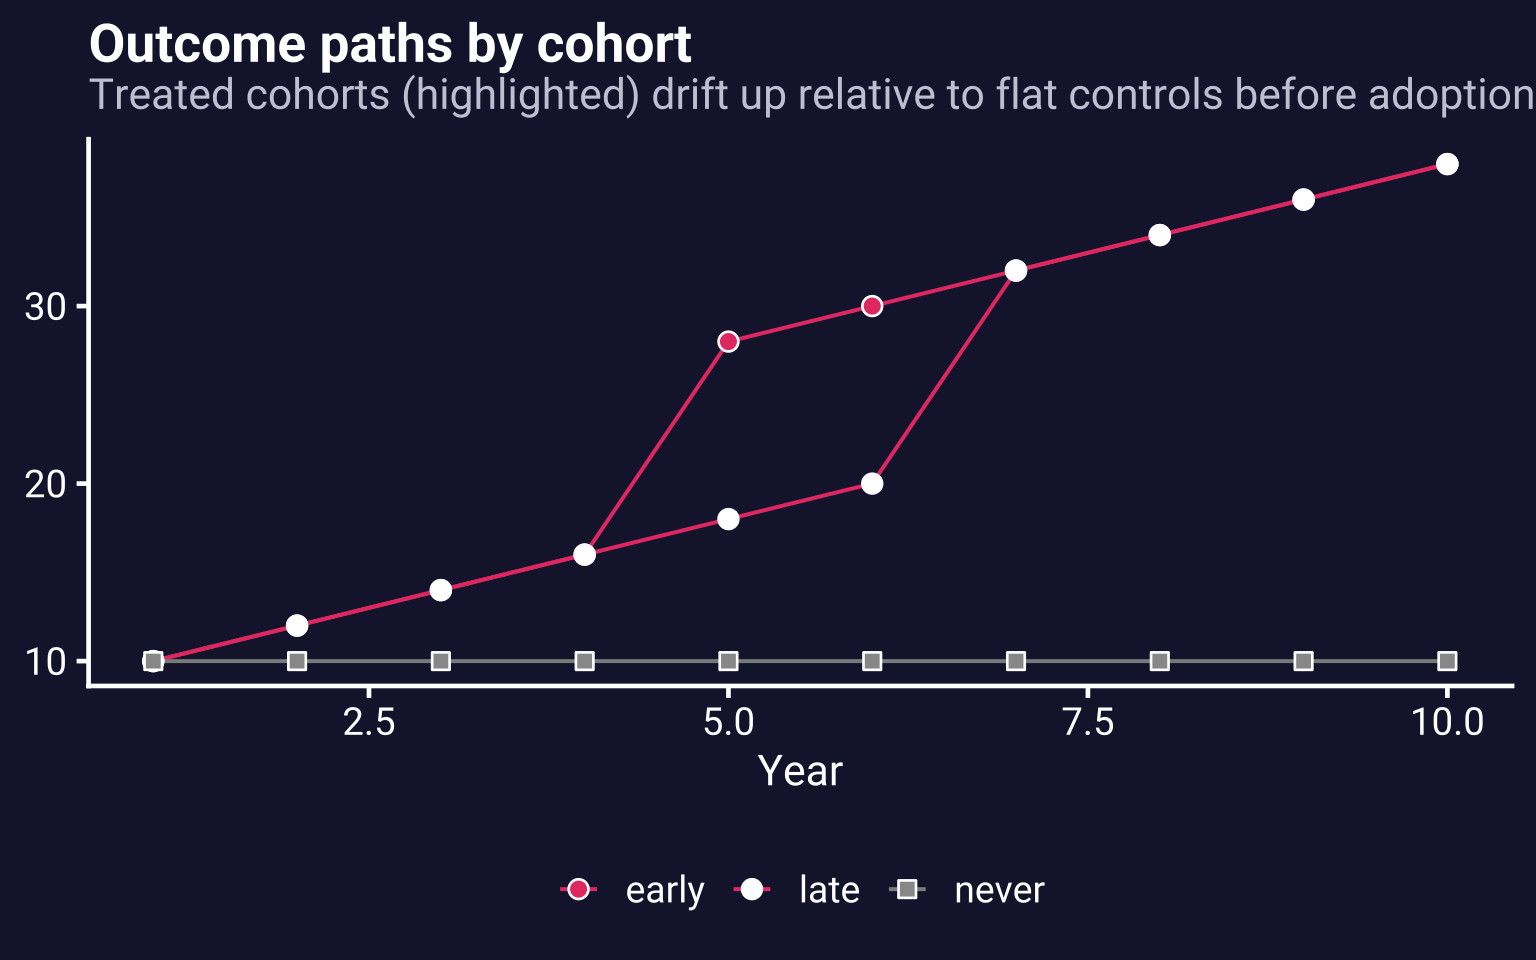
A tiny, deterministic staggered-adoption panel — 12 units over 10 years, no noise — in which the treated cohorts sit on a differential linear trend relative to the never-treated controls, so the parallel-trends assumption is violated before anyone is treated. Drawn as an event study around adoption, the pre-treatment coefficients are visibly non-flat: the teachable diagnostic that a post-period estimate cannot be read as a causal effect. It is the companion to signflip; the same mechanism can be dialed into the interactive app by giving the treated cohorts a nonzero slope.
Codebook
Variable
Type
Description
id
integer
Unit identifier (1–12)
group
character
"early" (4 units, adopt year 5), "late" (4 units, adopt year 7), or "never" (4 units, never treated)
adopt_year
integer
Treatment adoption year; NA for never-treated
year
integer
Calendar year (1–10)
outcome
numeric
Deterministic outcome base + slope·(year − 1) + effect; no noise, so worked numbers are exact
Every treated unit drifts up 2 units/year relative to the flat controls in every period and receives a true effect of +10 at adoption. With kappa_pre = kappa_post = 3 the normalized event-study coefficients are exactly −4, −2, 0 for t = −3, −2, −1 and 12, 14, 16, 18 for t = 0…3.
Source and citation
Generated deterministically by the package (data-raw/unparallel.R). No external data. See Wing, C., Freedman, S., & Hollingsworth, A. (2024). Stacked Difference-in-Differences. Working paper.