smoke

Daily county-level fine-particulate (PM2.5) concentrations for 2016, paired with the date each county’s state first experienced a wildfire smoke plume that year. Smoke plumes arrive on different days in different places, so the first-smoke date is a staggered “treatment” you can stack around to study its effect on air quality. The high-frequency daily structure also makes it a useful stress test for building stacks on date variables rather than calendar years.

Codebook

Variable Type Description
fips integer County FIPS code
date Date Observation date (YYYY-MM-DD)
first_smoke_day Date Date the county’s state first saw a smoke plume in 2016
dietal_pm25 numeric County-average PM2.5 concentration (µg/m³)

Source and citation

Smoke plume data: NOAA Hazard Mapping System (HMS) Smoke Product (https://www.ospo.noaa.gov/products/land/hms.html#stats-smoke).

PM2.5 data:

Di, Q., Wei, Y., Shtein, A., Xing, X., Castro, E., Amini, H., Hultquist, C., Shi, L., Kloog, I., Silvern, R., Kelly, J., Sabath, M. B., Choirat, C., Koutrakis, P., Lyapustin, A., Wang, Y., Mickley, L. J., Daouk, Y., & Schwartz, J. (2024). Daily and Annual PM2.5 Concentrations for the Contiguous United States, 1-km Grids, Version 1.10 (2000–2016). Palisades, NY: NASA Socioeconomic Data and Applications Center (SEDAC). doi:10.7927/G2N9-CA10 (accessed 2026-01-21).
The data

library(stacked)
data(smoke, package = "stacked")
head(smoke)
    fips       date first_smoke_day dietal_pm25
1: 32001 2016-01-01      2016-02-19    2.836990
2: 32001 2016-01-02      2016-02-19    3.740298
3: 32001 2016-01-03      2016-02-19    3.914205
4: 32001 2016-01-04      2016-02-19    3.058287
5: 32001 2016-01-05      2016-02-19    2.468622
6: 32001 2016-01-06      2016-02-19    1.930888
dim(smoke)
[1] 10615     4

Preview

source("../assets/style-web.R")

d <- copy(smoke)
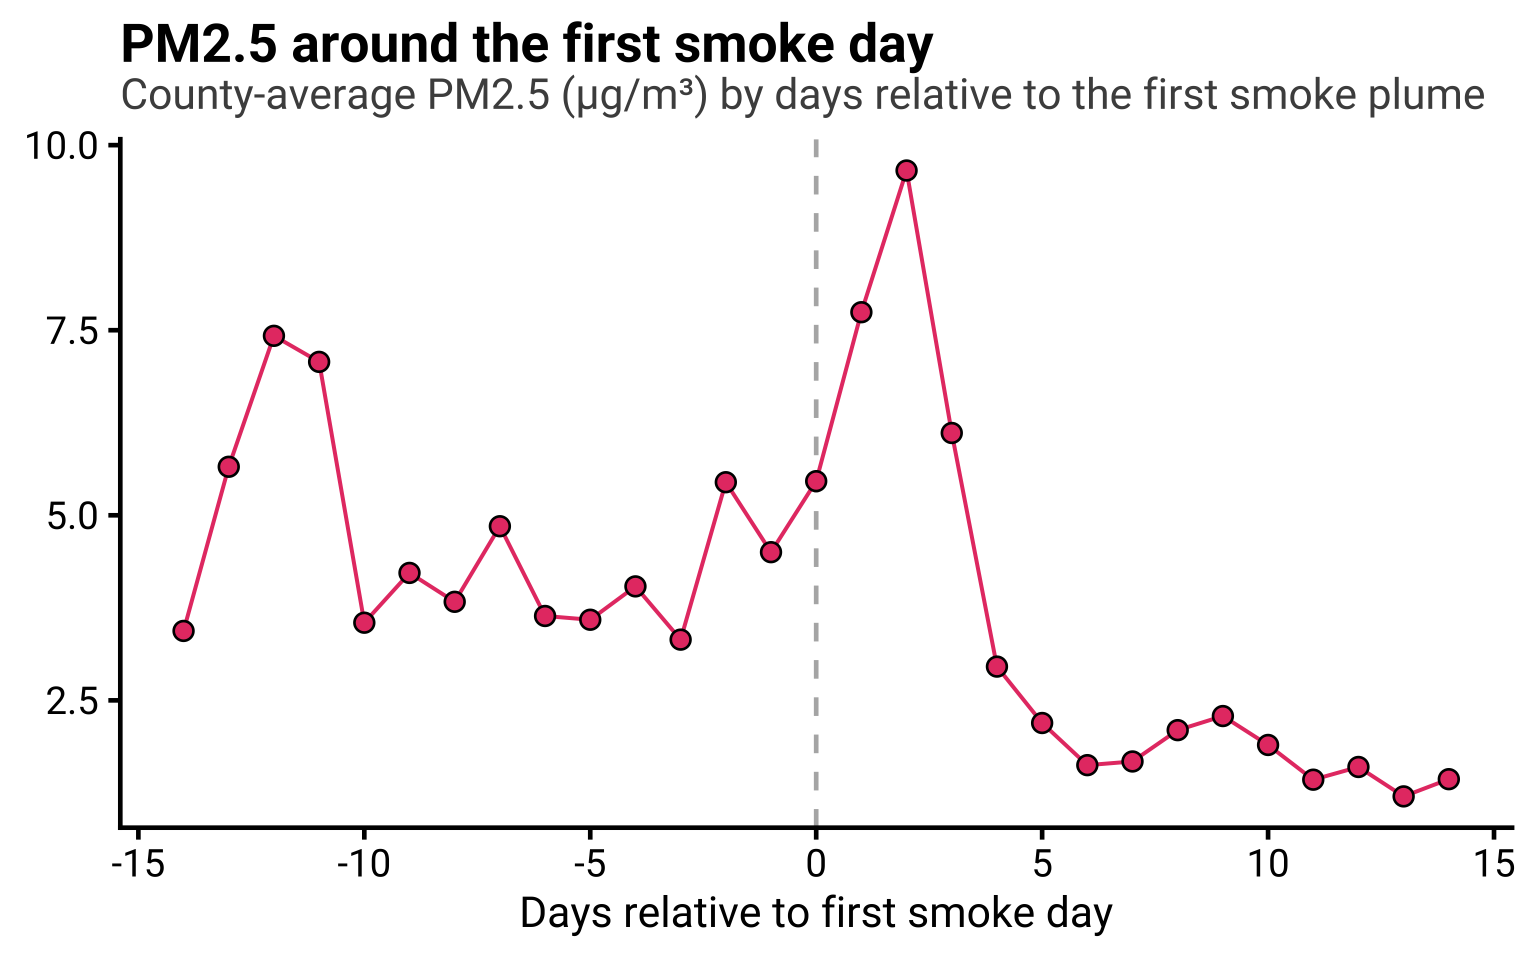
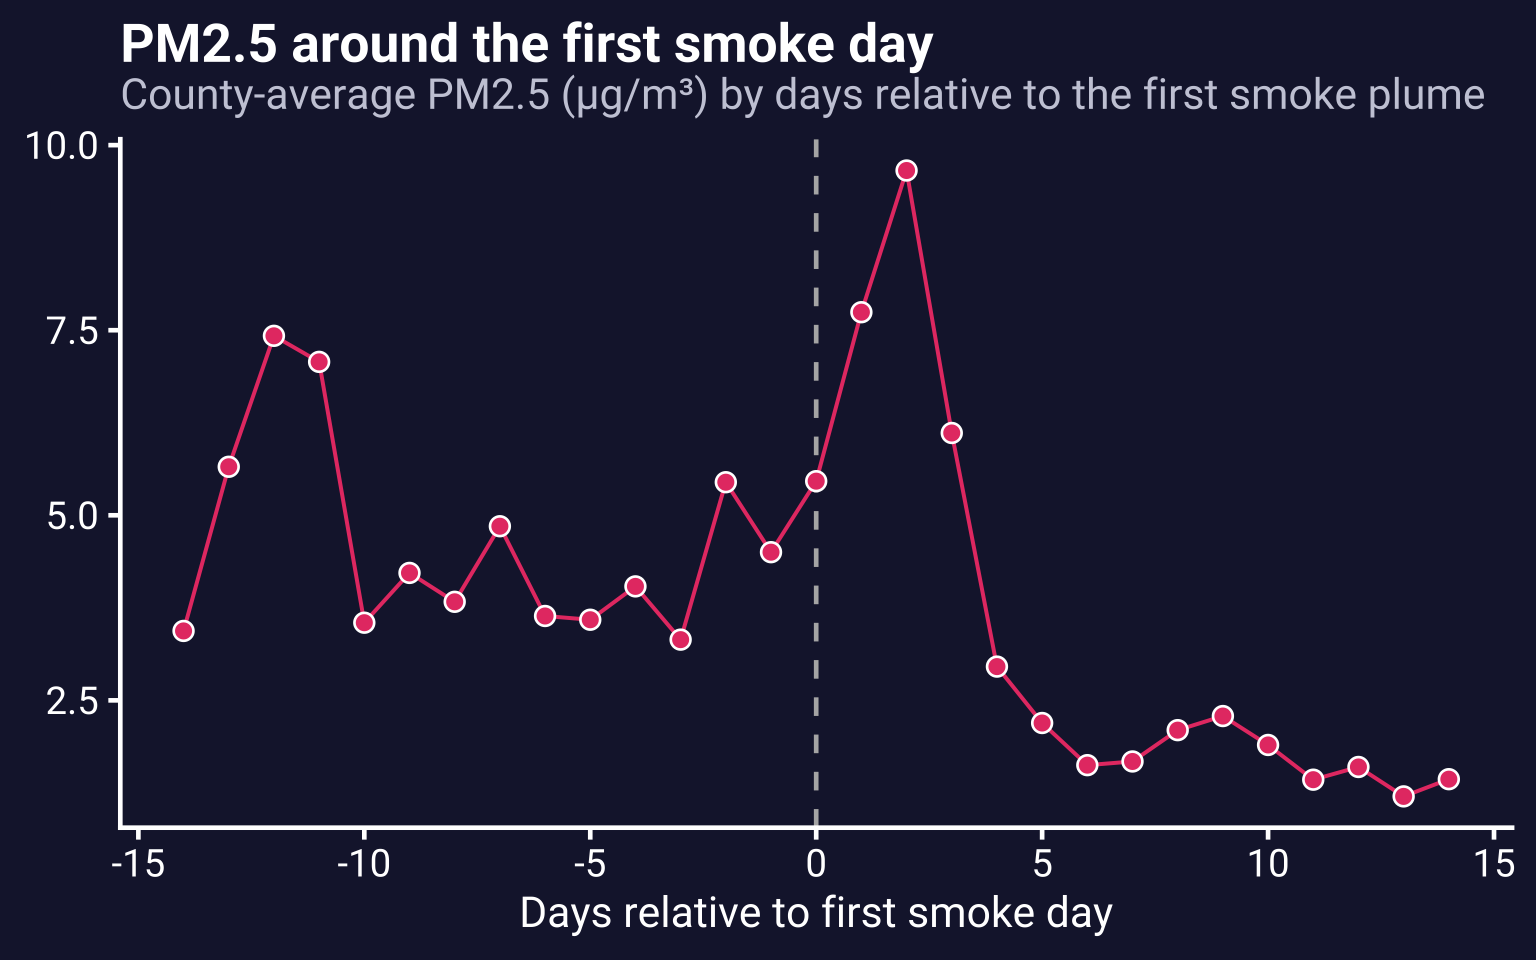
d[, rel_day := as.integer(date - first_smoke_day)]
win <- d[rel_day >= -14 & rel_day <= 14,
         .(pm25 = mean(dietal_pm25, na.rm = TRUE)), by = rel_day]

p_preview <- ggplot(win, aes(rel_day, pm25)) +
  geom_vline(xintercept = 0, linetype = "dashed", color = "grey70") +
  geom_line(color = highlight_color, linewidth = 0.7) +
  geom_point(shape = shp_primary, size = pt_size, stroke = pt_stroke,
             fill = highlight_color, color = border_color) +
  labs(title = "PM2.5 around the first smoke day",
       subtitle = "County-average PM2.5 (µg/m³) by days relative to the first smoke plume",
       x = "Days relative to first smoke day") +
  base_theme

Download

Load it

data(smoke, package = "stacked")
stacked use smoke, clear